
📊 Full opportunity report: Real-Time Warzone Visuals Just Got Smarter With AI on ThorstenMeyerAI.com — validation score, market gap, and execution plan.

Get the latest gadgets delivered free with Prime
- Fast, free delivery on millions of items
- Prime Video, Amazon Music and more included
- Member-only deals all year
TL;DR
A new AI-powered visualization tool now offers dynamic, cinematic displays of Bitcoin trading activity in real time. Built with browser technology, it visualizes market fluctuations as a battlefield, making complex data more engaging. This innovation enhances how traders and enthusiasts interpret market volatility visually.
AI-driven technology has significantly improved real-time visualizations of Bitcoin market activity, turning raw trade data into cinematic battlefield scenes accessible through any modern browser. This development offers a new way for traders, enthusiasts, and observers to interpret market volatility visually, emphasizing the power of web-based AI tools.
The system, called Bitcoin War, connects directly to public Binance and Coinbase trade streams via WebSocket, ensuring continuous data flow. It visualizes each trade as a combatant in a dynamic war scene, with buy orders represented as advancing forces from the left and sell orders from the right. Large liquidations are depicted as airstrikes, adding visceral elements to the visualization.
Built entirely with client-side browser technology, the system uses Canvas 2D graphics, WebAudio synthesis, and real-time stream processing, with a minimal footprint of roughly 180KB. An automatic camera shifts perspectives between broad battlefield views and detailed skirmishes, while a live DEFCON meter indicates market volatility. The visualization also features a scrolling war log narrating ongoing activity and a synthetic soundtrack generated within the browser, heightening the immersive experience.
Importantly, Thorsten Meyer emphasizes that Bitcoin War is not a trading tool; it does not involve wallets, signals, or advice. Its purpose is purely artistic and data-driven, providing viewers with a visceral understanding of market chaos. The project is freely accessible at war.isbitcoindead.com, offering a new way to experience trading data visually and emotionally.
Implications of AI-Enhanced Market Visualization
This development demonstrates how advanced web technologies and AI can create immersive, real-time visualizations of complex data, making market activity more engaging and understandable for a broader audience. It highlights the potential for artistic applications of financial data, fostering new ways to interpret volatility and market dynamics without traditional trading tools.
For traders, analysts, and enthusiasts, such visualizations could offer alternative insights into market sentiment and activity, potentially influencing how market data is perceived and analyzed. Additionally, this showcases the growing role of browser-based AI tools in data visualization, emphasizing accessibility and real-time performance.
Bitcoin market visualization software
As an affiliate, we earn on qualifying purchases.
As an affiliate, we earn on qualifying purchases.
Evolution of Visualizing Market Data with Web Tech
Traditional financial data visualization relies on charts, graphs, and dashboards, often requiring specialized software. Recent advancements have seen the integration of AI and web technologies to produce more interactive and immersive representations. The Bitcoin War project builds on this trend by translating live trade streams into cinematic battle scenes, emphasizing the raw chaos and tension of markets.
Developed by Thorsten Meyer, the project leverages browser-native technologies, avoiding backend infrastructure, and achieves a sophisticated visual and auditory experience entirely client-side. Its release follows a broader movement towards artistic and experiential data representations, aiming to make complex market activity accessible and emotionally resonant.
“Bitcoin War is not a trading tool; it’s an artistic visualization that captures the chaos of markets in a cinematic form.”
— Thorsten Meyer
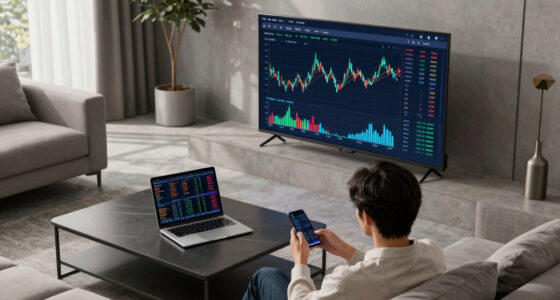
real-time cryptocurrency trading display
As an affiliate, we earn on qualifying purchases.
As an affiliate, we earn on qualifying purchases.
Unanswered Questions About AI-Driven Visualizations
It is not yet clear how scalable or customizable the AI-enhanced visualization system will become, or whether it will be adopted beyond artistic demonstrations. The long-term impact on market analysis or trading strategies remains uncertain, as the tool is explicitly not designed for trading decisions.
Additionally, questions remain about the potential for AI to further automate or personalize such visualizations, and how different market conditions might influence the visual narrative.
browser-based market data visualization tools
As an affiliate, we earn on qualifying purchases.
As an affiliate, we earn on qualifying purchases.
Future Developments in Visual Data Art and Market Tech
Further updates may include enhanced AI features for more detailed or interactive visualizations, possibly integrating user input or additional data streams. The project’s creators might explore partnerships or broader applications in educational or entertainment contexts. Monitoring how the community responds and whether similar tools emerge will be key to understanding its future trajectory.
Expect ongoing enhancements and potential wider accessibility, as web technologies and AI continue to evolve in the realm of data visualization.
AI-powered financial data visualizer
As an affiliate, we earn on qualifying purchases.
As an affiliate, we earn on qualifying purchases.
Key Questions
Is this visualization tool meant for trading decisions?
No, Bitcoin War is an artistic visualization designed to depict market activity visually. It does not provide trading signals or advice.
How does the AI improve the visualization?
The AI integration enhances the dynamic, cinematic quality of the visualization, allowing for real-time adjustments and immersive effects that reflect market volatility more vividly.
Can I customize or modify the visualization?
Currently, the visualization is a fixed, publicly accessible experience. Customization options are not available, but future updates might include more interactive features.
Does this tool work on all browsers?
It requires a modern browser that supports Canvas 2D graphics, WebAudio, and WebSocket technology. The project is designed to run instantly and seamlessly in compatible browsers.
Will this visualization be used for actual market analysis?
No, it is intended for artistic and educational purposes only, not for trading or investment decisions.
Source: ThorstenMeyerAI.com
Fall Picks
fall essentials
As an affiliate, we earn on qualifying purchases.